


Daily Technical Analysis: Swiss Franc falls as USDCHF Recovers from its Historical Lows

Swiss Franc falls as USDCHF recovers from its historical lows
Following downtrend breakout, USDCHF sets eyes on 0.8400 levels
A downtrend with three major resistance levels has been broken on the USDCHF 4H chart, with short term moving averages MA(5) and MA(10) crossing over MA(30). This price action suggests further gains on the pair. Movement today is expected to be slow in anticipation of PCE inflation numbers from the U.S.
USDCHF 4H Chart
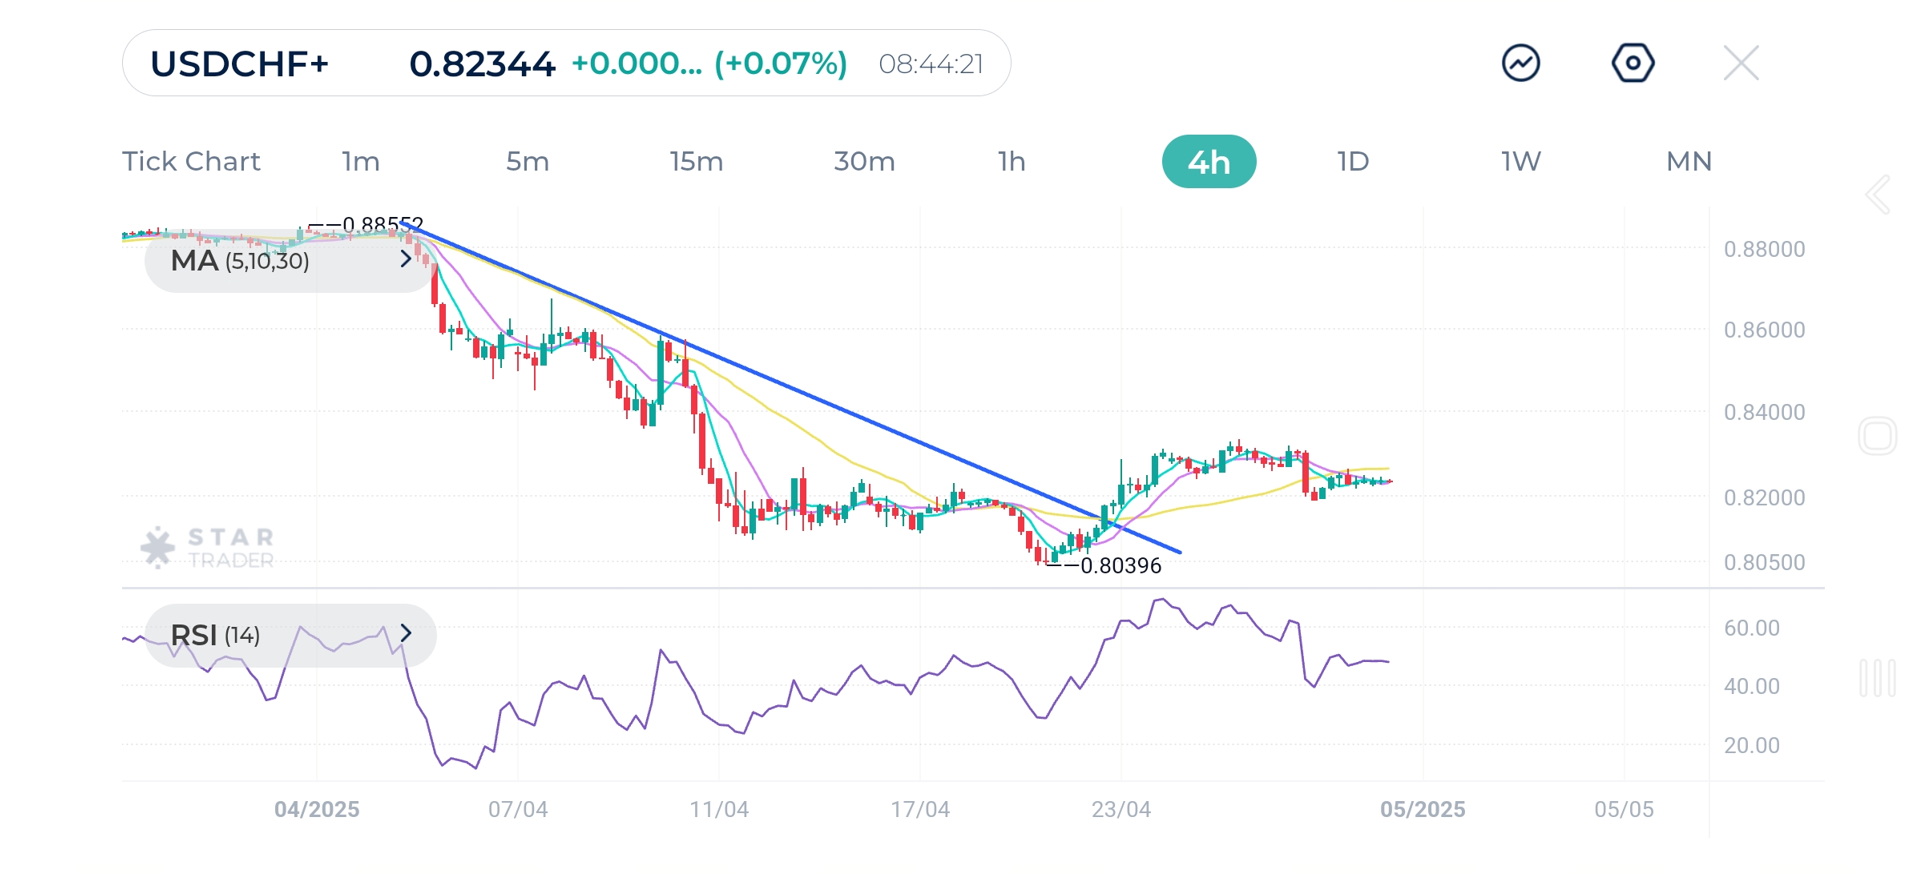
| Resistance | 0.8315 | 0.8334 | 0.8394 |
| Support | 0.8200 | 0.8069 | 0.8041 |
Gold prices move in consolidation awaiting breakout of triangle pattern
Following the sharp decline in gold prices after hitting the all-time high of $3,500 gold prices have been moving in consolidation for the past few days between $3,265 and $3,349 levels and closing in. A breakout below $3,300 levels which represent a psychological level and the lower line of the triangle pattern, this may indicate further drops to $3,275 and $3,265 levels.
Gold (XAUUSD) 1H Chart
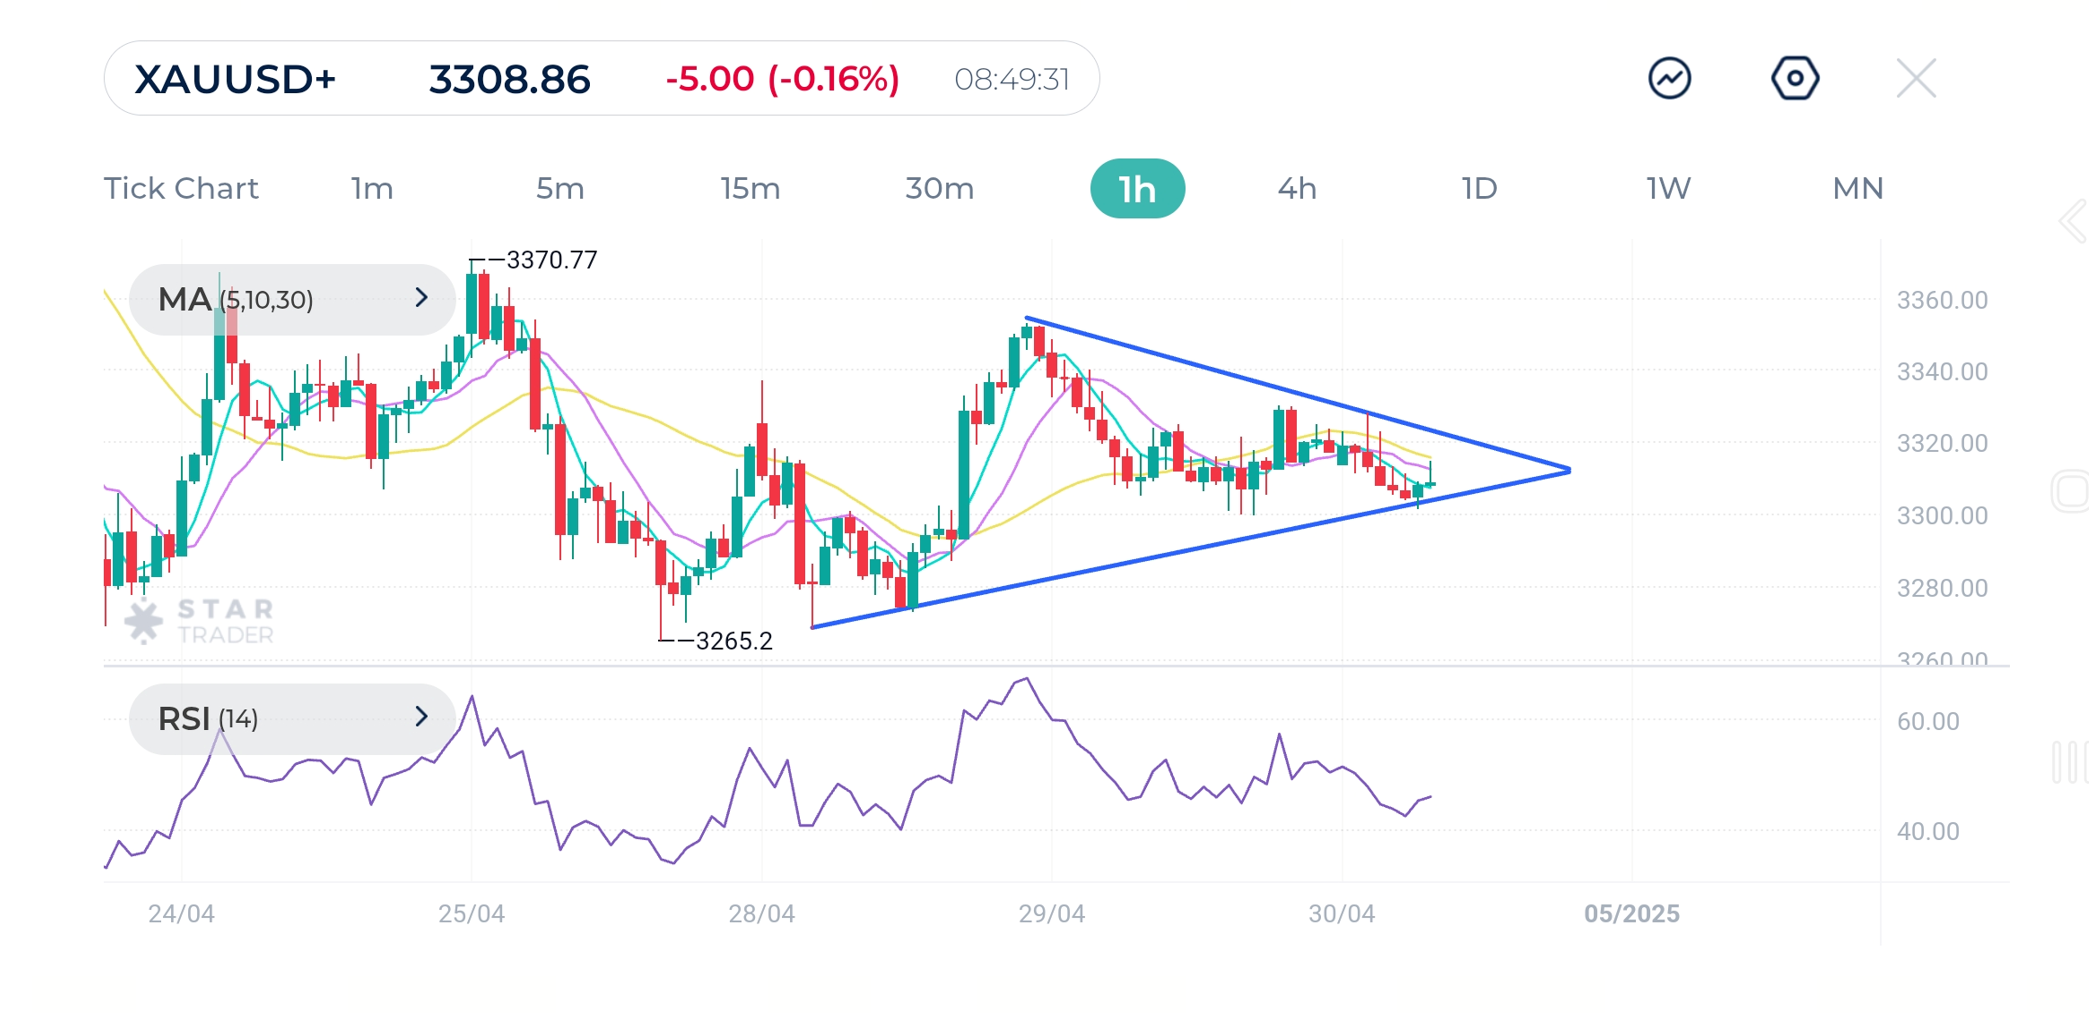
| Resistance | $3,330 | $3,353 | $3,371 |
| Support | $3,299 | $3,287 | $3,268 |
Bitcoin shows strong upward momentum
Bitcoin is facing major resistance level at $95,264 but it’s supported by the moving averages (5) and (10) in short term trading.
A close above $94,986 level could drive prices up towards $99,872 level this week.
RSI is nearing the overbought level, but still has more room for upward movement.
Bitcoin (BTCUSD) Daily Chart
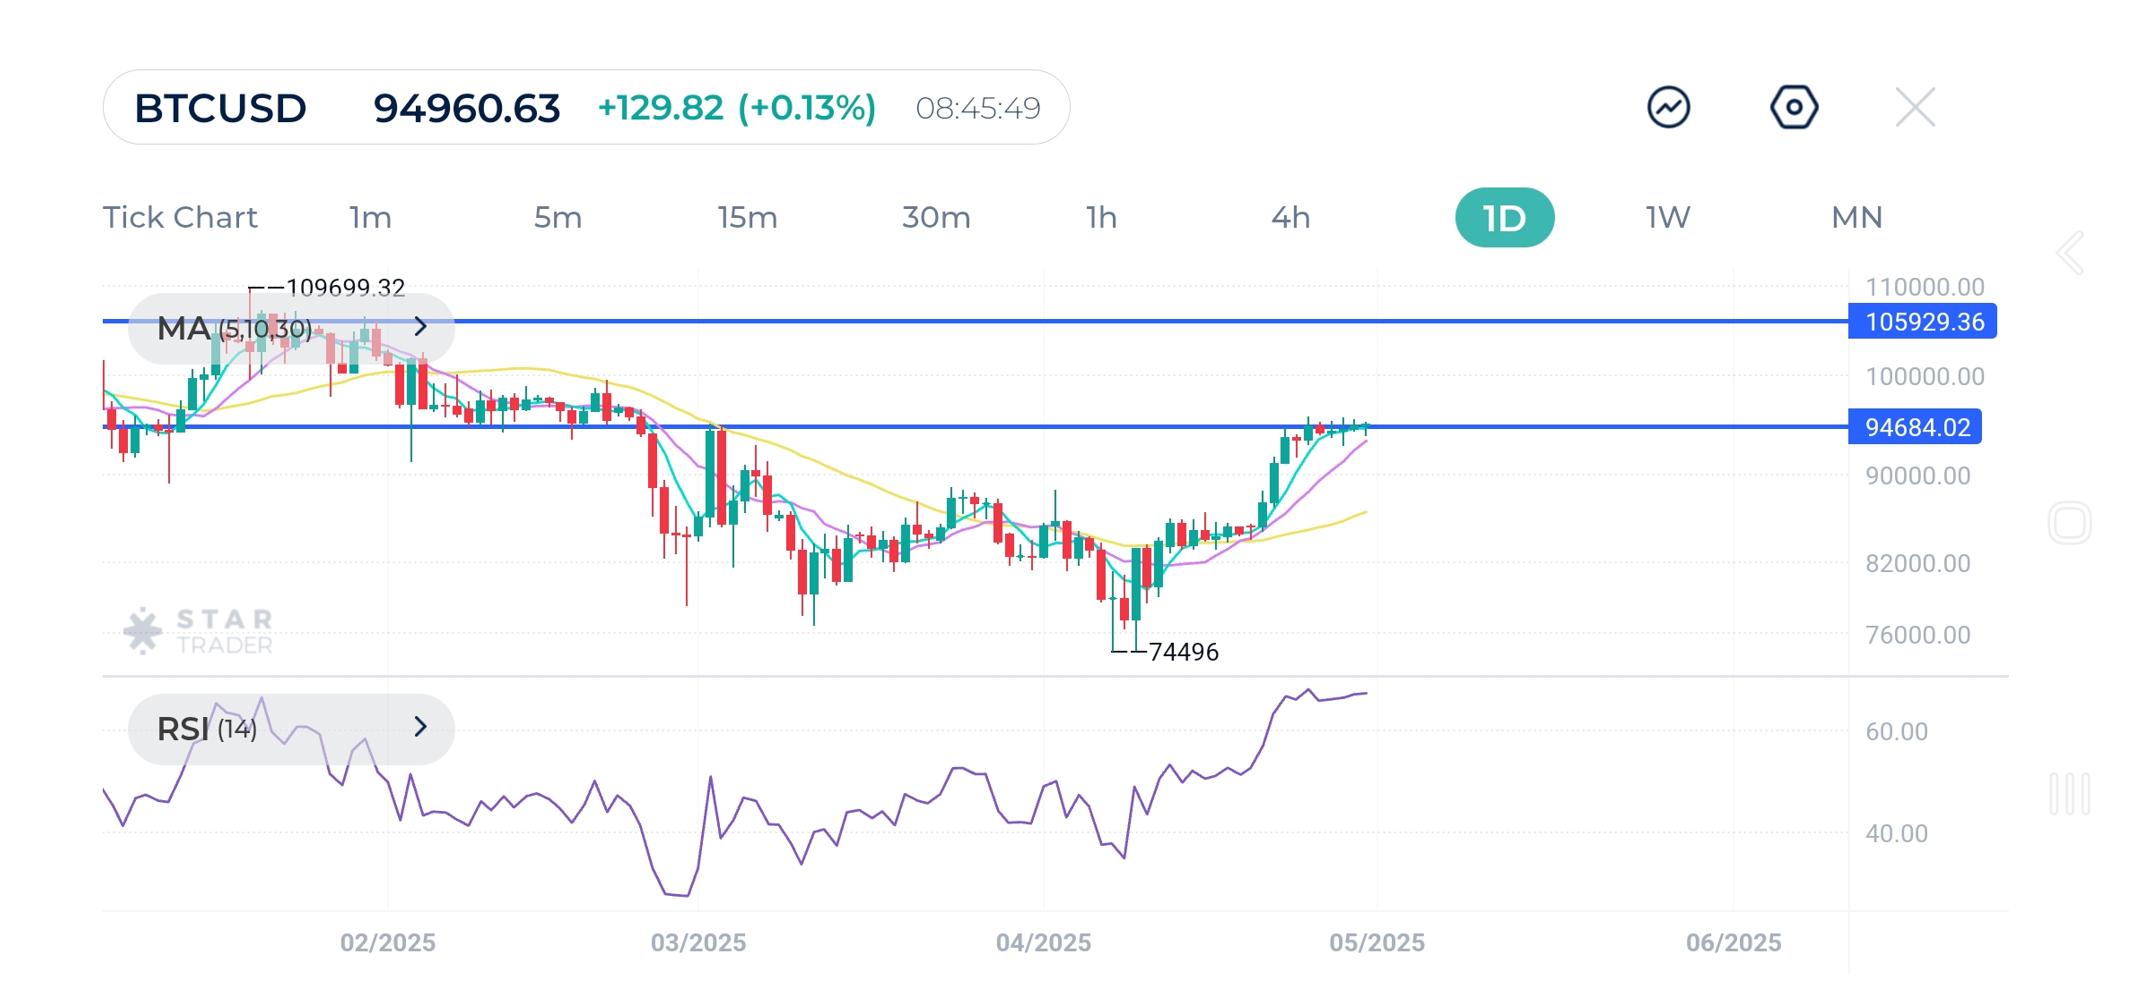
| Resistance | $99,371 | $100,334 | $102,566 |
| Support | $92,930 | $91,814 | $89,735 |
