


Daily Technical Analysis: Oil Declines Again After Bullish Correction, Brent at $61

Dow Jones 1H Chart
Dow Jones Industrial Average shows bullish momentum today with all short term and mid term moving averages trending upward on the hourly chart. The index might face resistance at the 41,451 level, which represents the monthly high.
Breaking and closing above this level on the hourly chart will indicate buying pressure is then expected to push prices higher towards 41,560
RSI is approaching the overbought zone, but still mostly neutral. A strong decline below 41,000 psychological level might put more pressure on the index, bringing it to the 40,800 level.
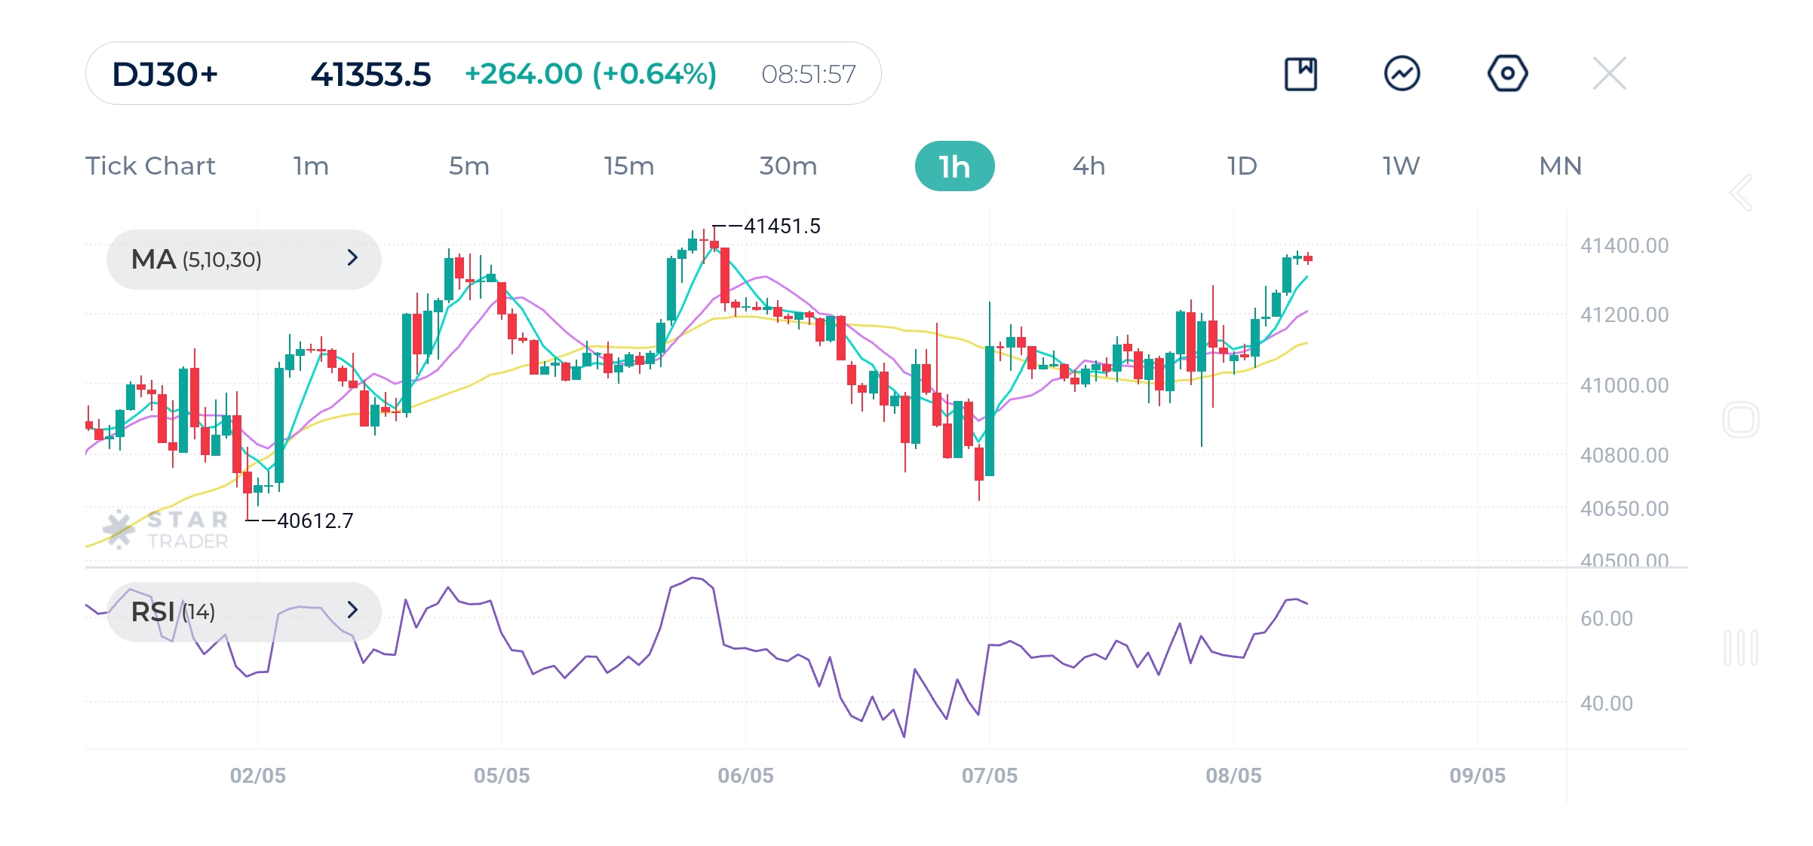
| Resistance关键支撑 | 41,451 | 41,560 | 41,751 |
| Support 阻力位 | 41,280 | 41,133 | 41,021 |
Brent UKOUSD 4H Chart
Oil prices have recovered from the sharp fall at the beginning of the month. The 4H chart shows clear short term downtrend. Moving averages MA(5), MA(10), and MA(30) show indecisiveness. RSI is moving in the neutral zone around 50.
The downward trendline is expected to hold prices below $64 levels. However, a strong break and close above the trendline will indicate a possible reversal upwards.
The major resistance level to watch out today is $63.75. If price fails to reach that level or shows bearish price action when approaching it, more declines are expected.
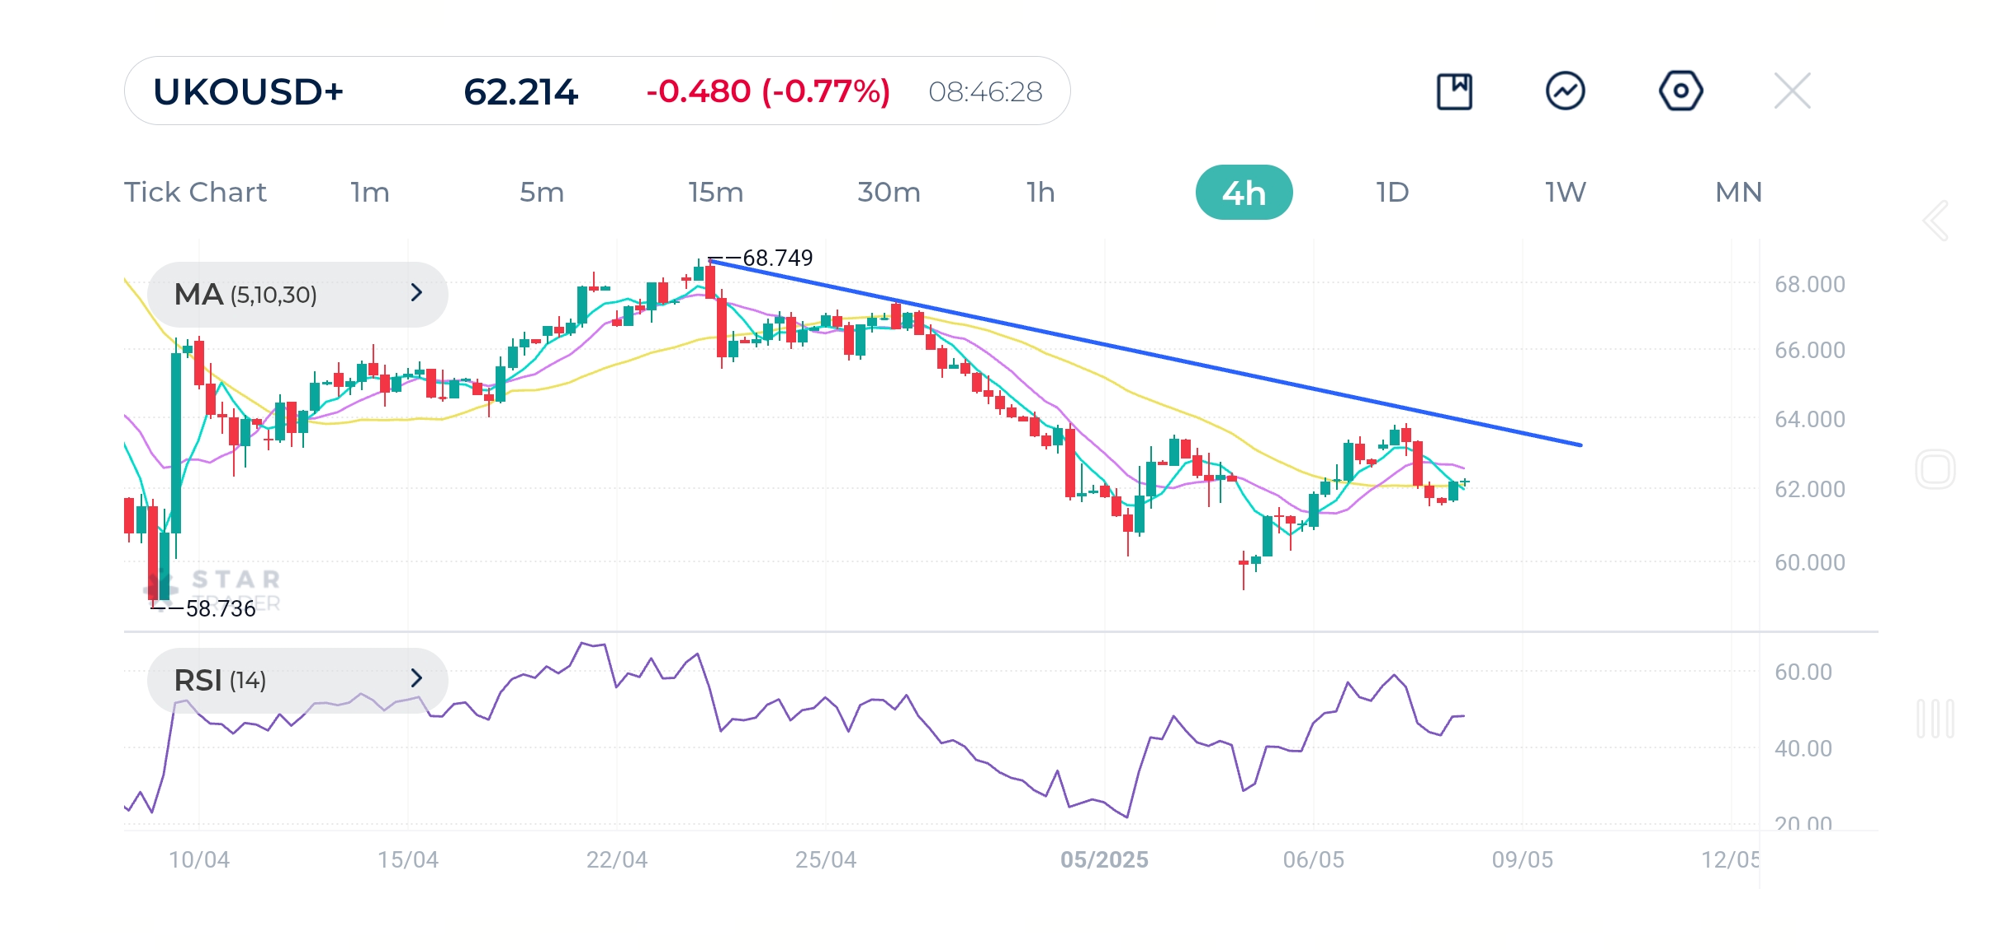
| Resistance关键支撑 | $62.12 | $63.05 | $63.68 |
| Support 阻力位 | $60.62 | $59.87 | $59.47 |
USDJPY 1H Chart
The USDJPY pair broke above the downtrend line on the hourly chart, indicating bullish momentum and buying pressure. Short term moving averages are trending upwards and providing dynamic support for the price.
The pair is expected to hold above 143.00 levels and push towards 145.00. Watch out for dynamic support represented by the moving average MA(30).
RSI still shows room for more bullish momentum.
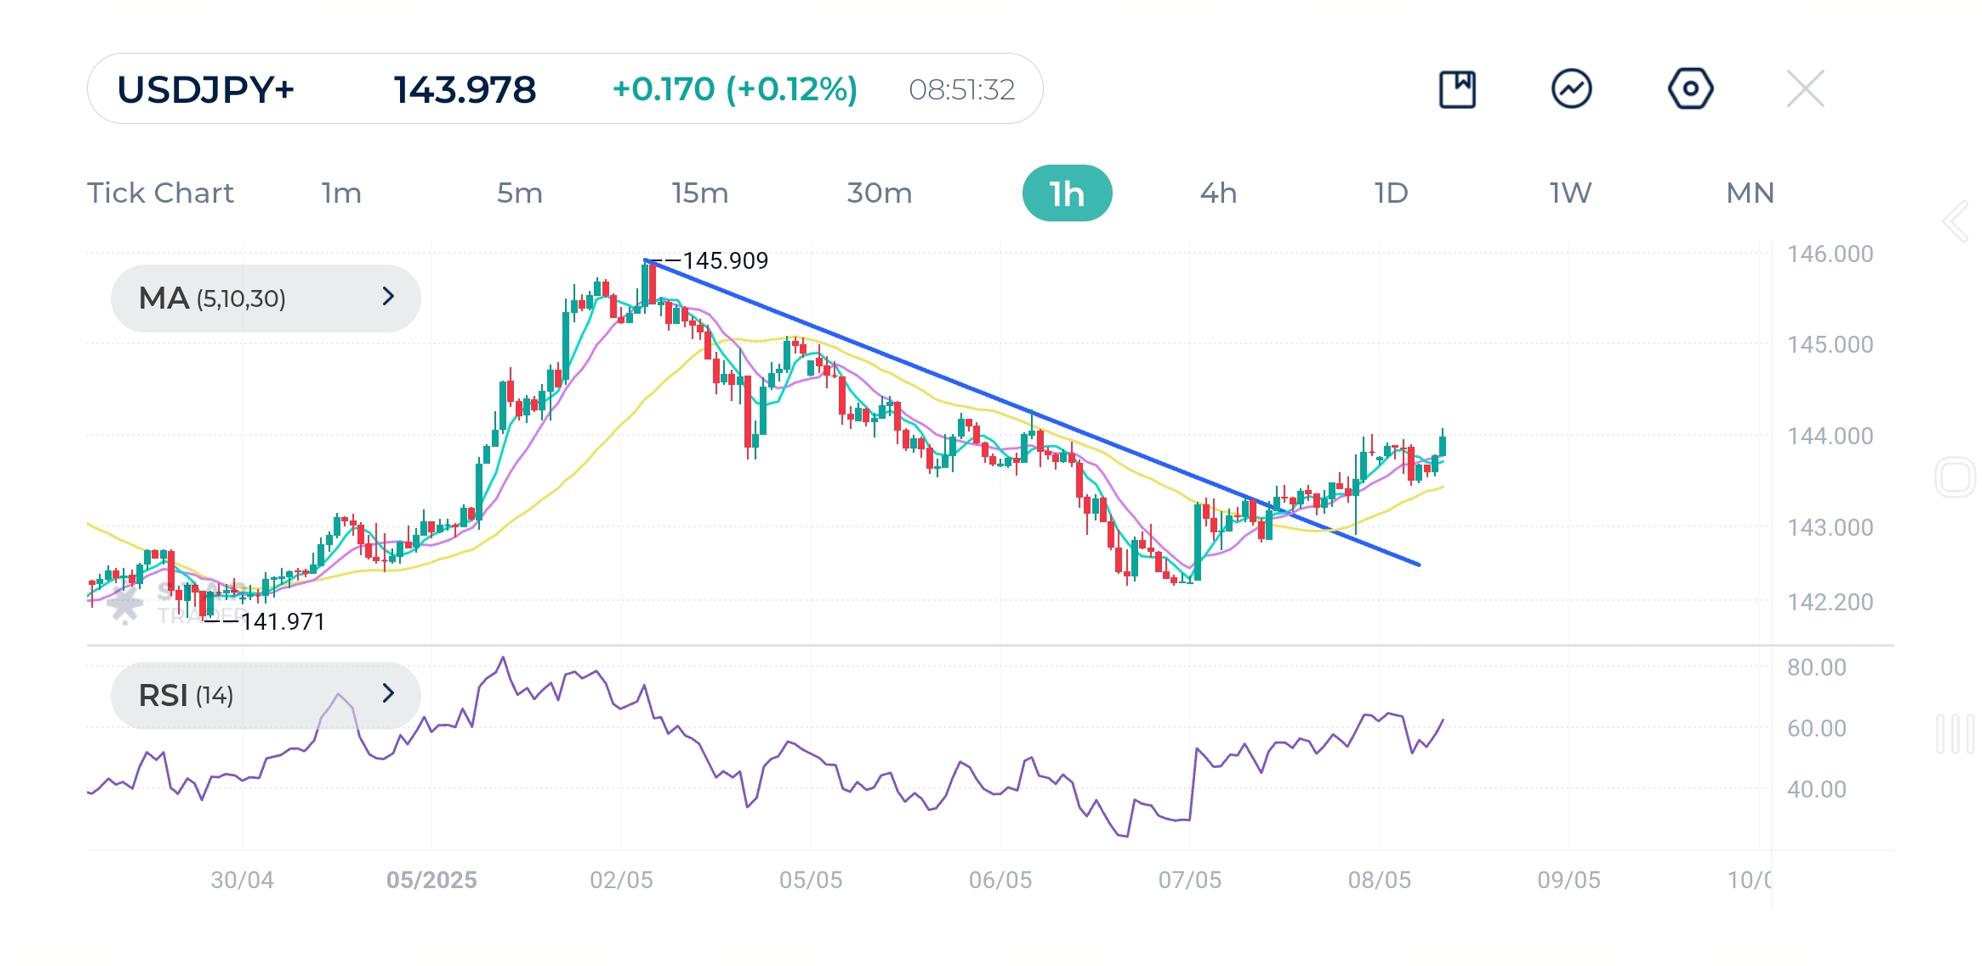
| Resistance关键支撑 | 144.28 | 144.43 | 145.08 |
| Support 阻力位 | 143.46 | 142.93 | 142.75 |
