


Daily Technical Analysis: Oil Falls to Lowest Level Since 2021

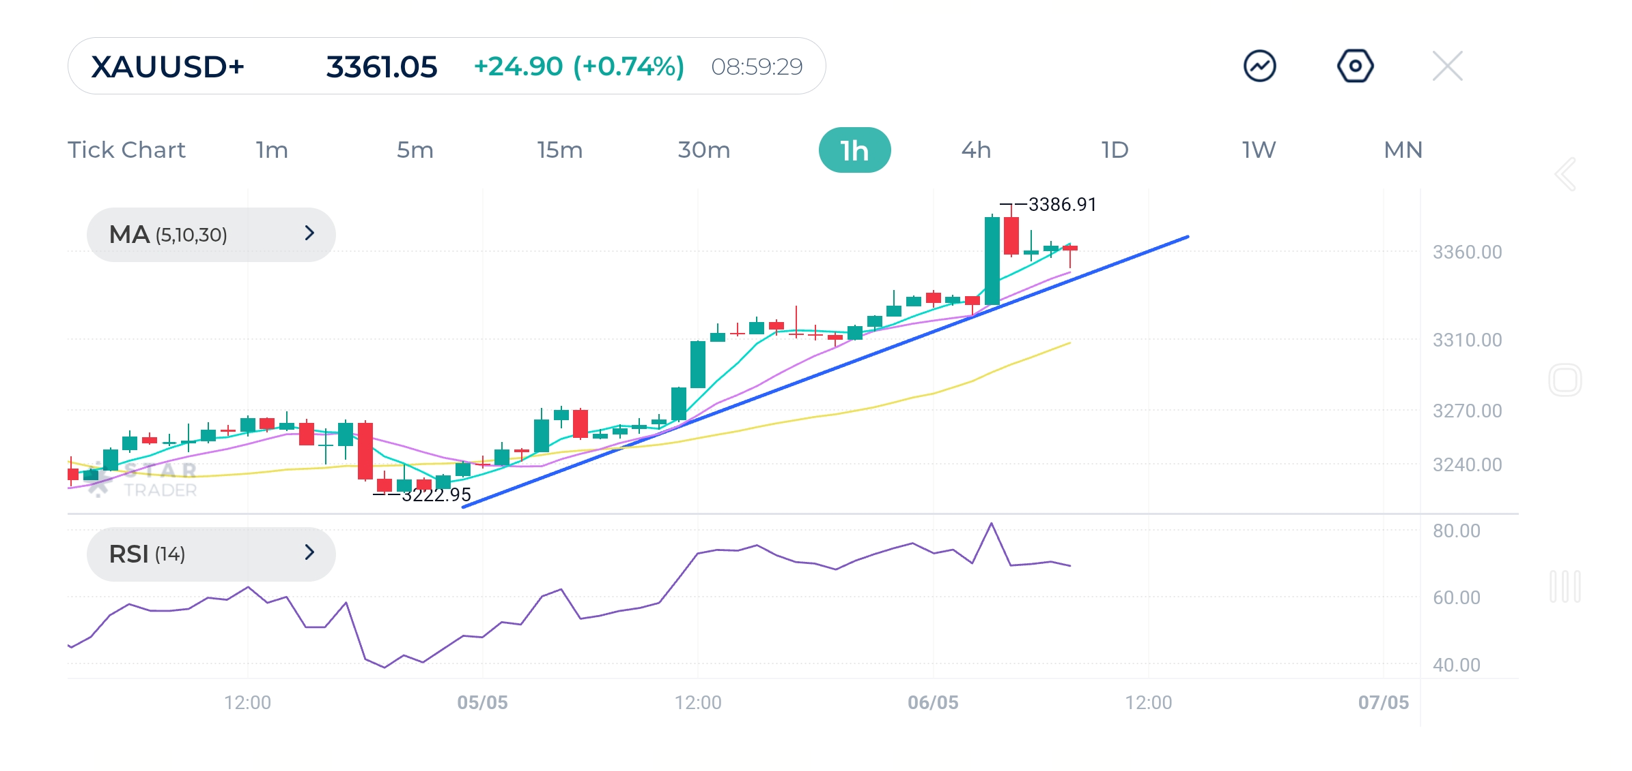
Gold shows Strong uptrend with price respecting a rising trendline on the hourly chart. All short-term moving averages are aligned bullishly and act as dynamic support. The relative strength index i currently around 65–70 indicating bullish sentiment, but approaching the overbought area. Key levels to watch for short term movement are:
Support: $3322.95 (swing low and trendline dynamic support).
Resistance: $3386.91 (recent high).
The price is moving in a healthy uptrend. As long as the rising trendline holds, dips are potential buying opportunities. A break above $3386.91 could signal continuation toward new highs, aiming for $3400+.
Gold (XAUUSD) 1H Chart
| Resistance | $3,386 | $3,402 | $3,433 |
| support | $3,350 | $3,323 | $3,305 |
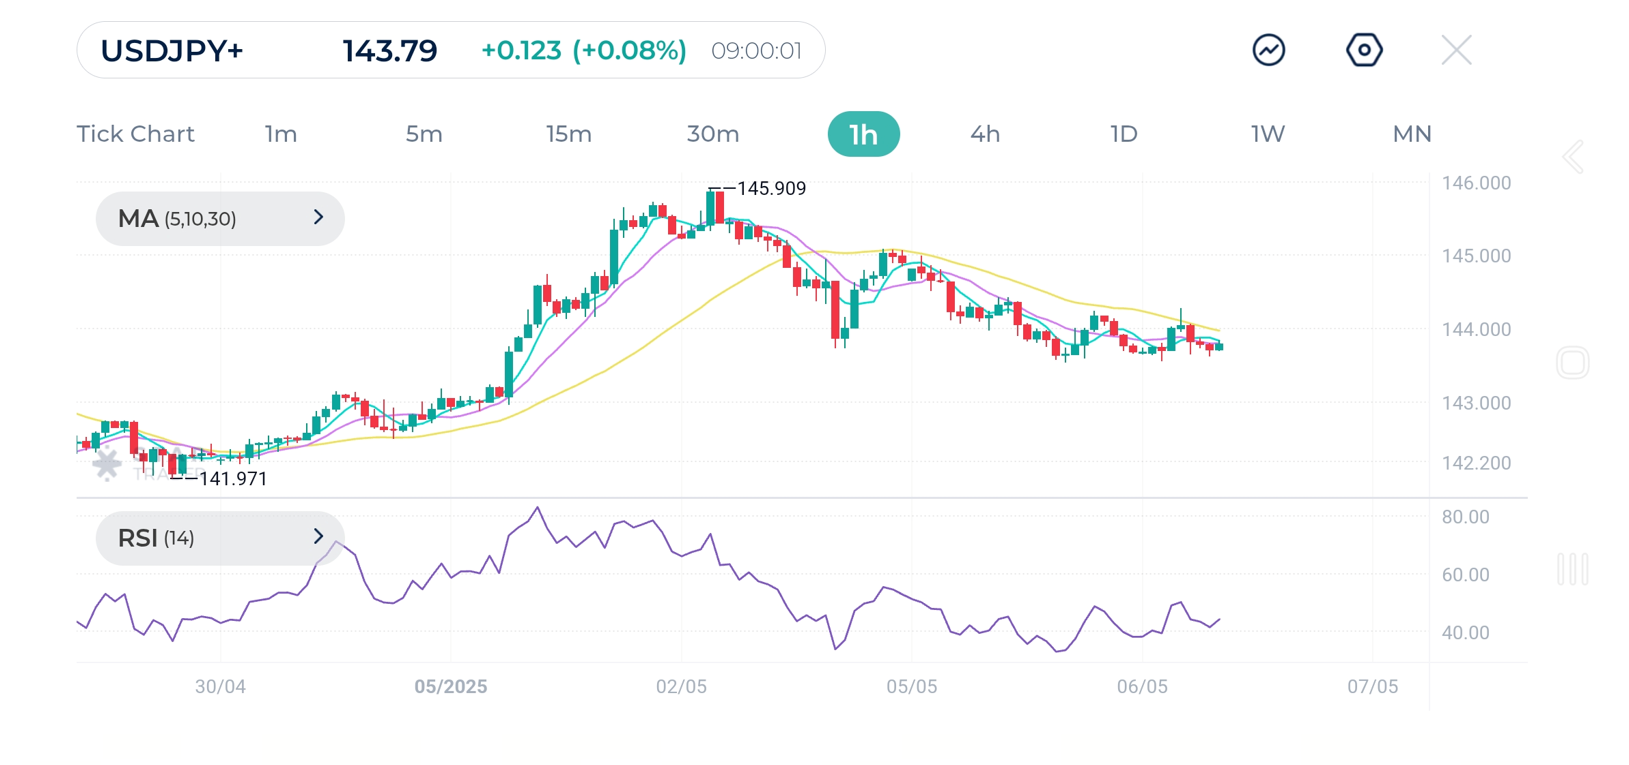
USDJPY shows Sideways to Slightly Bearish sentiment. Rounded top is forming forming after recent peak at 145.909.
Price is currently below the short-term moving averages 5 & 10 which are crossing below the 30, signaling weakness. RSI (14) is below 50, showing fading bullish momentum.
Key Levels to watch for today are:
Support: 143.00–143.20 (consolidation area).
Resistance: 144.50–145.00 (former support acting as resistance now).
Momentum is fading on the pair, and it is moving in a consolidation area after a sharp rise. A break below 143.00 may trigger further downside movement toward 142.00. Otherwise, range-bound price action will continue until a new breakout.
USDJPY 1H Chart
| Resistance | 144.28 | 144.43 | 145.07 |
| support | 143.55 | 142.96 | 142.49 |
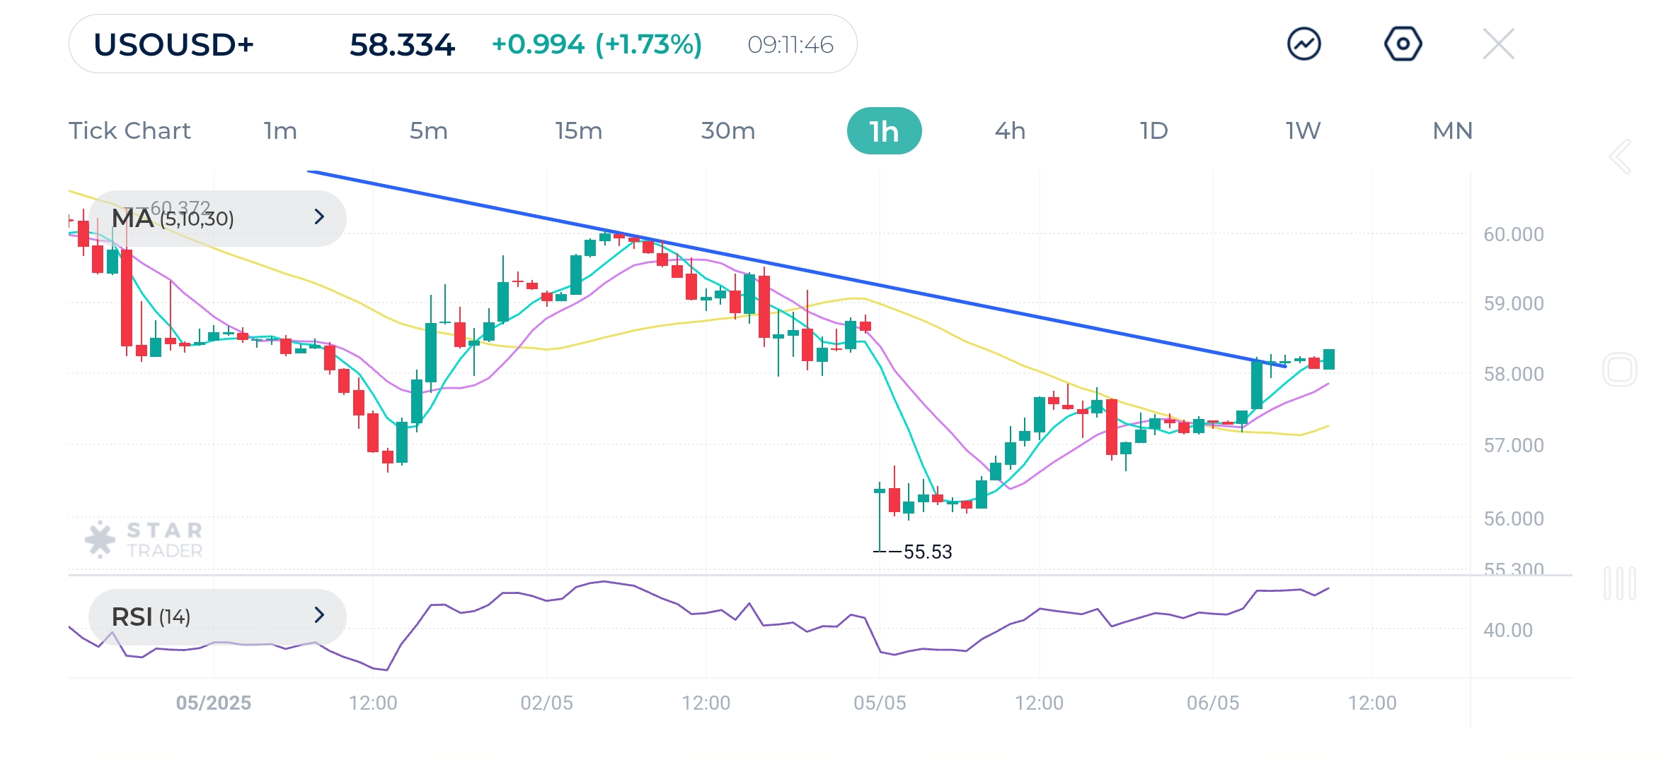
West Texas Intermediate (WTI) shows Breakout Setup with a downtrend line (descending resistance) recently broken.
Short term moving averages (5, 10) have crossed above the 30-period MA, confirming bullish bias.
RSI is approaching 60, indicating growing bullish strength, but it’s not yet overbought.
Key Levels to watch out for today are:
Support: $55.53 (recent swing low).
Resistance: $59.00–$60.00 zone (important psychological level).
The break above the descending trendline with bullish moving average crossover suggests a reversal from bearish to bullish bias. If price remains strong and closes above $58.00, move toward $59.50–$60.00 levels is expected
Oil (USOUSD) 1H Chart
| Resistance | $58.35 | $58.69 | $59.51 |
| support | $56.82 | $56.19 | $55.61 |
